Using Metrics and Stories: What is Measurement?
Lucidea
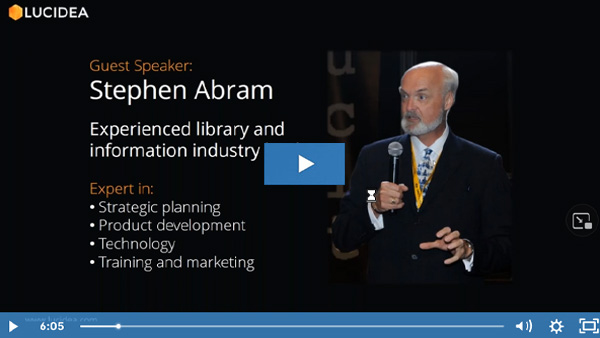
We presented a second “KM Conversation” with experienced library and information industry leader Stephen Abram. “Using Metrics and Stories: What Does Success Really Look Like?” was a lively discussion between Mr. Abram and Phil Green, Lucidea’s COO, focused on best practices in collecting and using metrics to build stories that demonstrate what success looks like for your special library or information center.
During our session “Using Metrics and Stories: What Does Success Really Look Like?” Stephen shared his thoughts on what measurement actually is and why it’s important.
Measurement is a couple of statistics together, that imply a result and demonstrate a direction to the numbers, allowing you to make inferences. The “direction” Stephen spoke of isn’t just a simple view of “costs go down, or revenue goes up.” The result and the direction must be something that your audience understands, and it must meet their particular goals. When we in the library world present performance data to the CFO or COO, we must use our numbers in ways that illustrate how we meet their goals, and help them look correctly at what we are measuring. It is worth noting that we should not measure activity; that just says how much effort went in, but doesn’t say anything about what was accomplished.
Areas of importance when measuring include effectiveness, efficiency, impact and value. If you are talking about savings, they must be tied to something important, such as the aforementioned effectiveness or efficiency, or better yet: alignment with organizational strategy. Stephen pointed out that the accomplishment to be measured should not be tied to something negative for the organization. Yes, it’s easy to generate savings when the company is having a downturn, but you could easily be hurting long term growth if you fire the wrong people or get rid of your most important or useful products and resources.
To present useful measurements, you must understand the context of your audience—what motivates them? When they query you, are they simply exploring or questioning… is it just critical thinking, rather than a prelude to making cuts or launching some other threat?
You also need to understand how they adopt information. Most people in the academic space will read a 30-page report, for example. Other stakeholders need instant interpretation. There are strategies for displaying measurements and their result or direction that require you to pre-digest it, and perhaps make it more visual for engineers or museum professionals, or offer text that is clean and direct for text-based learners, such as lawyers. Choose your visuals carefully and align them with stakeholders’ learning styles.
When presenting measurements in order to demonstrate success, justify additional resources, or for any other reason, you must proceed carefully—and choose carefully from your collection of hundreds of data points. If you overwhelm your audience, they will be confused and likely not on your side… and unable to “take your story higher.” Per Stephen, it’s critical that your measurements move minds, not simply move information.
Hear more from Stephen Abram and Phil Green on this and related issues when you link to “Using Metrics and Stories: What Does Success Really Look Like?” And if you have suggestions for additional topics or speakers in our series of “KM Conversations,” with such luminaries as Euan Semple, Stan Garfield and Stephen Abram, please comment below and let us know.
 Watch now!
Similar Posts

Library Instruction: Learning Styles Are Out, Evidence-Based Practices Are In
For instructors and educators of all types, it’s vital to realize that evidence-based practices are more effective than catering to the myth of learning styles.
Interview with Susan Walsh:
Dirty Data, AI, and the 2nd Edition of “Between the Spreadsheets”
Author Susan Walsh discusses the new edition of “Between the Spreadsheets,” sharing insights on fixing dirty data, AI’s impact, and her COAT framework.
Interview with the Author:
Dr. Kate McDowell on Storytelling for Libraries
Dr. Kate McDowell shares how data storytelling helps libraries advocate, counter misinformation, and build trust for future generations.

4 Library Marketing Strategies Every Special Librarian Can Use
Whether you manage a corporate, government, or nonprofit library, knowing how to promote your services is essential for visibility and impact.