Lucidea’s Lens: Knowledge Management Thought Leaders Part 89 – Valdis Krebs

Stan Garfield
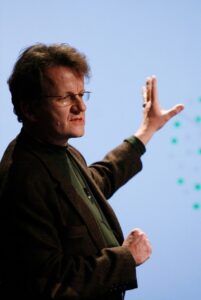 Valdis Krebs is a management consultant and Founder and Chief Scientist at Orgnet LLC. He is the developer of InFlow, a software-based, organization network analysis methodology that maps and measures knowledge exchange, information flow, communities of practice, networks of alliances, and other networks within and between organizations. Through graphics and revealing measures, this technique allows managers to see what was once invisible.
As a data scientist, Valdis specializes in social, relational, and multimodal data analysis and visualization. As a network scientist, he applies artificial intelligence and social algorithms, data mining, organizational network analysis, and cluster analysis to business, community, and organizational projects. As a social scientist, he has over 20 years of organizational consulting and coaching experience, specializing in maps and metrics that reveal how an organization really works.
After living in Cleveland for many years, Valdis recently moved to Riga, Latvia. He intended to retire there, but his clients continue to keep him engaged.
Valdis created the following content which I have curated to represent his contributions to the field. You can also read the summary I wrote of his presentation at the 9th Midwest KM Symposium.
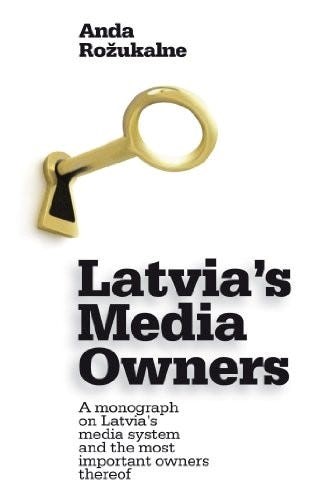
Book
Valdis designed the network maps in Anda Rozukalne’s Latvia’s Media Owners.
Social Network Analysis: An Introduction
Social network analysis [SNA] is the mapping and measuring of relationships and flows between people, groups, organizations, computers, URLs, and other connected information/knowledge entities. The nodes in the network are the people and groups while the links show relationships or flows between the nodes. SNA provides both a visual and a mathematical analysis of human relationships. Management consultants use this methodology with their business clients and call it Organizational Network Analysis [ONA]. ONA allows you to x-ray your organization and reveal the managerial nervous system that connects everything.
To understand networks and their participants, we evaluate the location and grouping of actors in the network. These measures give us insight into the various roles and groupings in a network — who are the connectors, mavens, leaders, bridges, isolates, where are the clusters and who is in them, who is in the core of the network, and who is on the periphery?
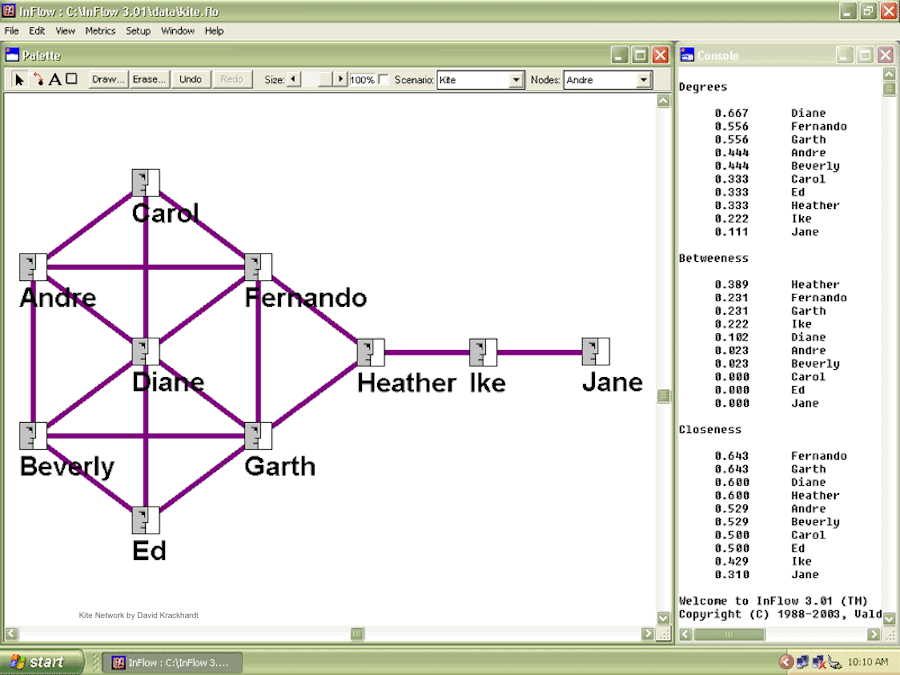
This network effectively shows the distinction between the three most popular individual centrality measures: Degree Centrality, Betweenness Centrality, and Closeness Centrality.
Employee Networks Reveal How Things Get Done in your Organization
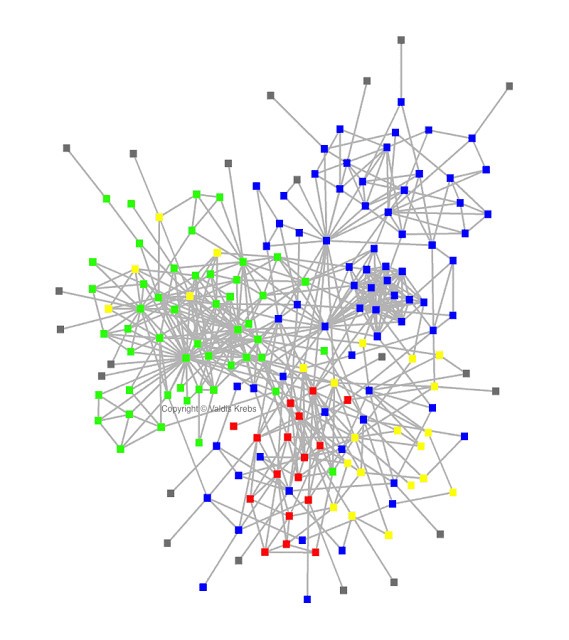
The organizational map above shows the email flows amongst a large project team in a Fortune 100 company. It is an x-ray of how the project actually works! Each person on the team is represented by a node. Each node is colored according to the person’s department — red, blue, or green. Yellow nodes are consultants, contractors, and other external specialists hired to work on this project. Grey nodes are not formal team members but are external experts consulted during the project.
…
The above diagram shows the project network soon after the missed deadline. Notice the clustering around formal departments — blues interacting with blues, greens interacting with greens. The initial communication in this project was very siloed! Several of the hubs in this network were under-performing and came across as bottlenecks. Project managers saw the need for more direct integration between the departments. One of the solutions was very simple, yet effective — co-location of more project team members — a surprising solution in the age of the Internet! Another solution was minor change in a policy and a business process. These small interventions improved the information flow, and reduced the communication load on the hubs, whose performance improved later in the project.
…
Once the regular monitoring of the network began, and the initial changes were made, no further deadlines were missed, and project members expressed how much better things worked after the intervention.
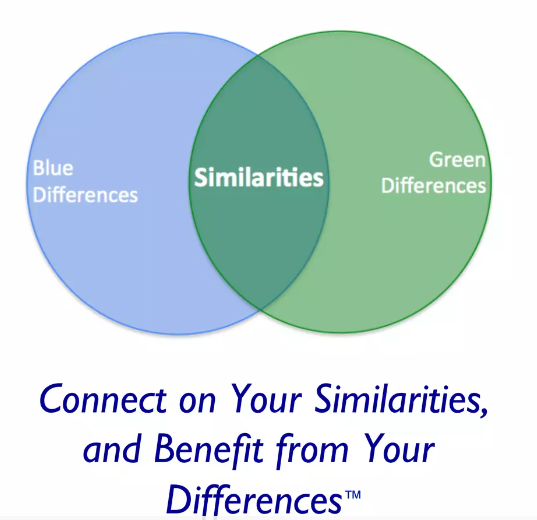
Knowledge and Learning in Organizations
Below is a graphic from Valdis’ 2018 SlideShare presentation on Knowledge and Learning in Organizations.

Stan Garfield
Please enjoy Stan’s blog posts offering advice and insights drawn from many years as a KM practitioner. You may also download a free copy of his book, Lucidea’s Lens: Special Librarians & Information Specialists; The Five Cs of KM from Lucidea Press, and its precursor, Proven Practices for Promoting a Knowledge Management Program. Learn about Lucidea’s Presto, SydneyDigital, and GeniePlus software with unrivaled KM capabilities that enable successful knowledge curation and sharing.
**Disclaimer: Any in-line promotional text does not imply Lucidea product endorsement by the author of this post.
Never miss another post. Subscribe today!
Similar Posts

Lucidea’s Lens: Knowledge Management Thought Leaders
Part 110 – Tom Stewart
In this Lucidea’s Lens profile Stan Garfield spotlights Tom Stewart—strategist author and former HBR editor—whose groundbreaking thinking redefined intellectual capital.

Lucidea’s Lens: Knowledge Management Thought Leaders
Part 109 – Dave Snowden
Dave Snowden Founder of The Cynefin Company applies complexity science anthropology and narrative to help organizations make sense of uncertainty and change.

Lucidea’s Lens: Knowledge Management Thought Leaders
Part 108 – George Siemens
In this edition of Lucidea’s Lens Stan Garfield profiles George Siemens—pioneering voice in connectivism and a driving force behind MOOCs and learning analytics—whose work continues to reshape how we understand learning knowledge creation and the role of technology in education and professional development.

Lucidea’s Lens: Knowledge Management Thought Leaders
Part 107 – Arthur Shelley
Explore Arthur Shelley’s insights on leadership co-creation and knowledge strategy through curated works that showcase his expertise in collaboration and innovation.


Leave a Comment
Comments are reviewed and must adhere to our comments policy.
0 Comments